|
Section 2. Cost of Living Comparison: Yellow Springs and Neighboring Communities, 2000
|
|
SECTION 2: COST OF LIVING COMPARISON: YELLOW SPRINGS AND NEIGHBORING COMMUNITIES The first question faced by the Research Design Committee was a choice of other communities with which we might compare Yellow Springs. Because each town is in some senses unique, a choice of criteria for this cost of living comparison was necessary. The criteria chosen were:
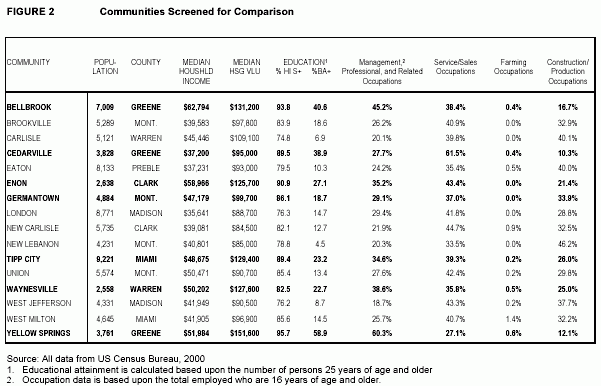
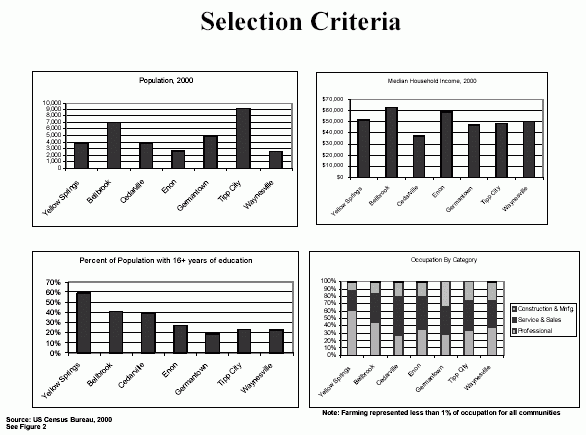
Based upon the first two factors mentioned above (size and geography), 15 towns and villages were identified for initial consideration. These communities and their relevant statistics are shown in Figure 2. Socio-economic variables were then obtained for each community from the Census, along with median housing value. The committee discussed the results and chose six communities for comparison. Selected communities are shown in the figure in bold type. Although somewhat similar in education and economic profile, they represent a broad cross section of sizes from 2,558 to 9,221 in population and are in five counties in the Southwestern region of Ohio: Clark, Greene, Miami, Montgomery, and Warren. |
 |
 |
 |
|
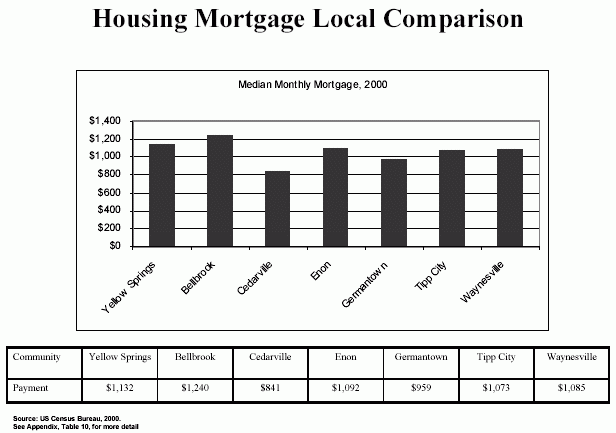
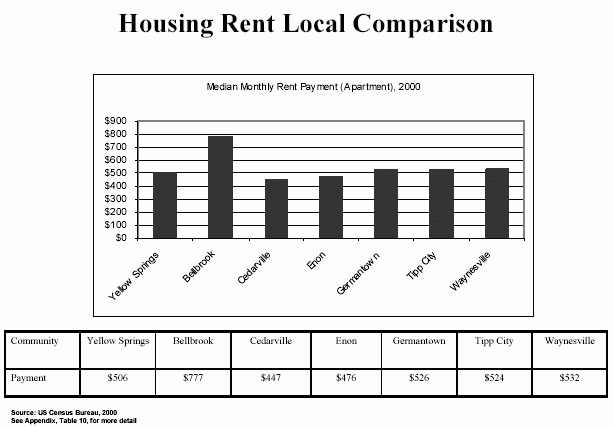
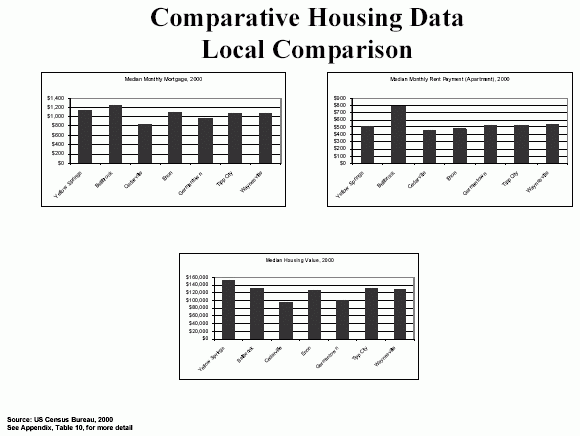
INTRODUCTION AND GOAL This section seeks to provide information about housing values and monthly costs for both homeowners and renters in all seven communities. Housing costs generally comprise a significant proportion of family expenses (28% according to the American Chamber of Commerce) and are thus examined in this cost of living report. PROCEDURE Three items were selected for comparing housing costs in Yellow Springs to other neighboring communities. The information for those items was obtained from the U.S. Bureau of the Census year 2000. The Housing Task Group obtained Tables DP-1 through DP-4, Profile of General Demographic Characteristics: 2000 for Yellow Springs and for each of the six comparison communities. The items selected from the DP Tables are presented in the list below. The charts in this section compare housing value, monthly mortgage, and the monthly rent payment, concluding with a chart that presents all three items on one page. For more detail, please refer to the Appendix, Table 10.
Data are displayed in the following charts in the same order for ease of comparison. Yellow Springs always appears first, followed by each of the comparable communities in alphabetical order: Bellbrook, Cedarville, Enon, Germantown, Tipp City, and Waynesville. |
 |
 |
 |
 |
|
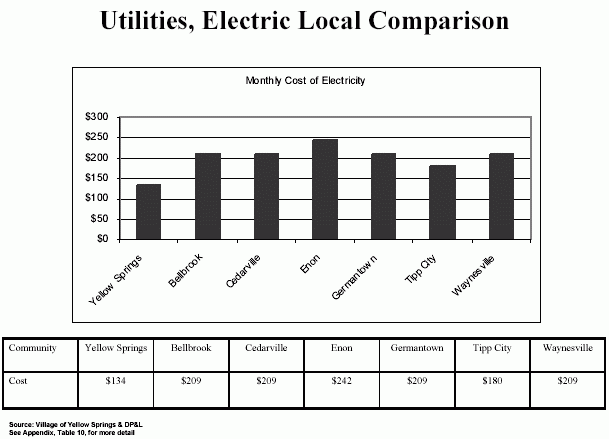
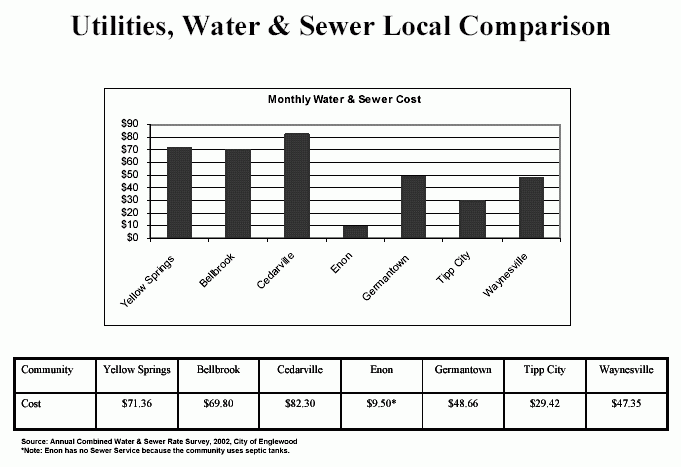
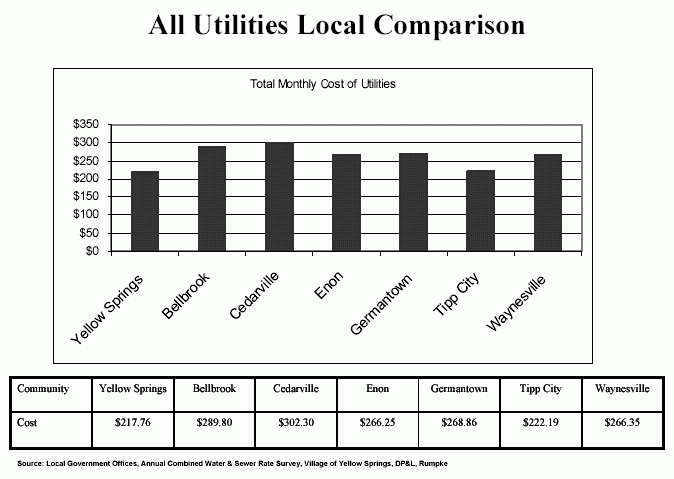
INTRODUCTION AND GOAL According to the American Chamber of Commerce, utilities make up 8% of living costs in the model. In seeking to standardize the Yellow Springs cost of living effort, utility costs were included in this local model as well. PROCEDURE Three items are included in this cost of living model for presenting the cost of utilities in Yellow Springs versus neighboring communities. The three items are:
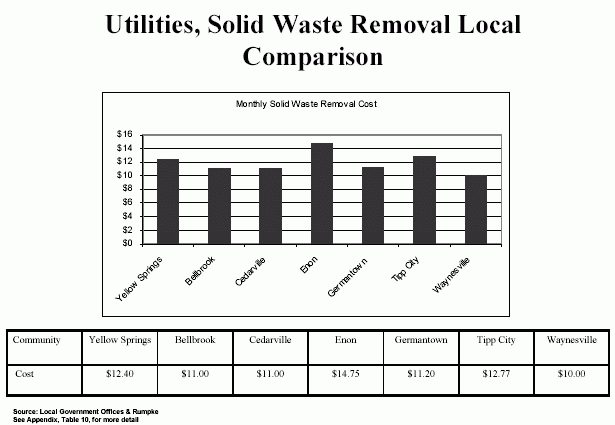
Three different sources were used to obtain information about these utilities. Water and sewer rates were obtained from the Annual Combined Water and Sewer Rate Survey sponsored by the City of Englewood Finance Department. Solid waste collection costs were obtained from local government offices in each of the seven communities. The cost of solid waste collection in Yellow Springs is organized along a sliding scale. To standardize costs for comparison purposes, Rumpke Waste Removal and Recycling was contacted to estimate the average number of gallons of solid waste disposed of by households in the Dayton area. The average number of gallons is 54, which resulted in an average cost of $12.40 for solid waste collection in Yellow Springs. Electric utility rates in Yellow Springs are also calculated based on a sliding scale, and the sliding scale formula was provided by the Village. Dayton Power and Light estimated the average usage of 2,200-kilowatt hours (kWh) in a month period for a 2,400 square foot home so that we could standardize electric utility costs across comparison communities. In Yellow Springs:
|
 |
 |
 |
 |
|
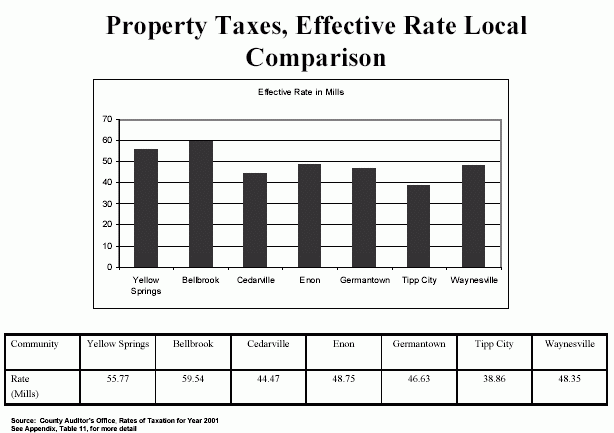
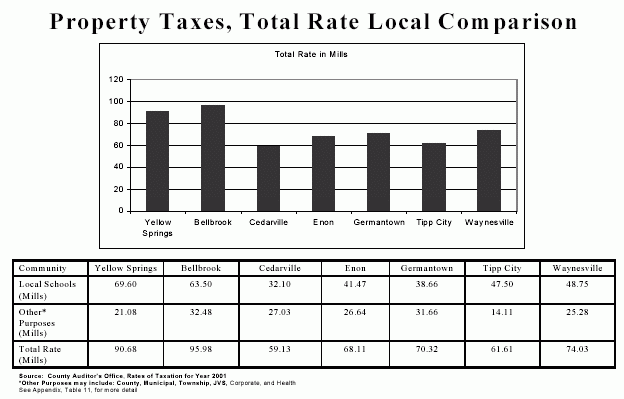
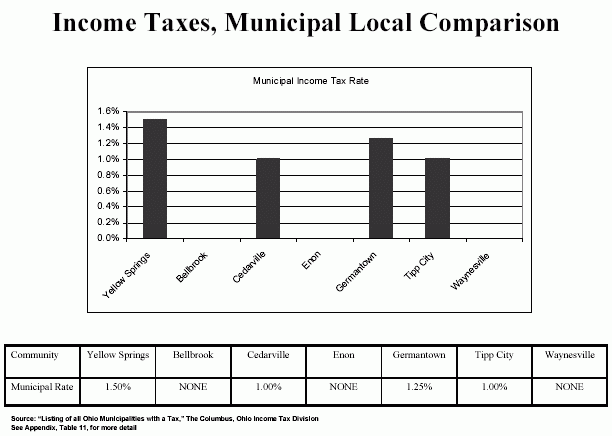
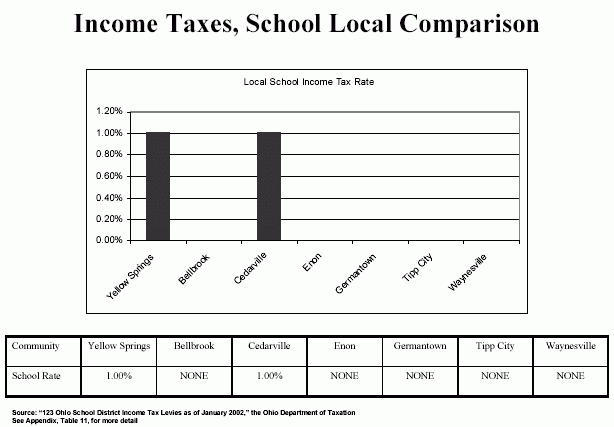
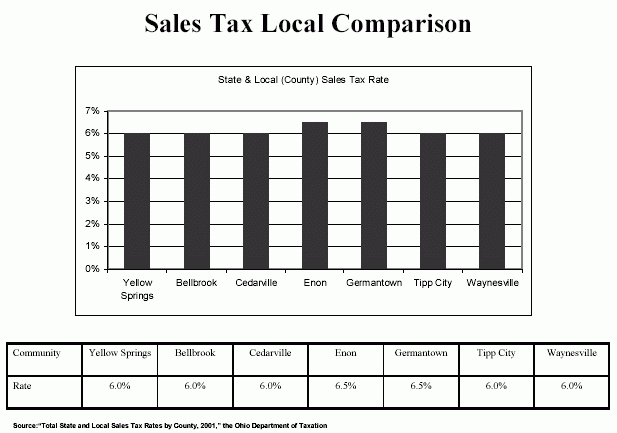
INTRODUCTION AND GOAL The American Chamber of Commerce cost of living model (on which we based the Yellow Springs model) excludes discussion of local costs, like taxes, because it is intended to compare regional cost of living differentials. Because this study of Yellow Springs is purposefully reporting costs on the local level, taxation was added to the model. PROCEDURE The Taxation Task Group gathered tax information for the items listed below. For property tax millage, they obtained information from the "Rates of Taxation for Year 2001" by county. For the school income tax, they obtained information from the "123 Ohio School District Income Tax Levies as of January 2002," the Ohio Department of Taxation (www.state.oh.us/tax/). For the municipal income tax, they obtained information from the "Listing of all Ohio Municipalities with a Tax," The Columbus, Ohio Income Tax Division (www.columbustax.net/munilist.htm). For sales tax information, they obtained information from "Total State and Local Sales Tax Rates by County, 2001," the Ohio Department of Taxation (www.state.oh.us/tax/). Property Taxes (presented as millage)0 Local Schools (not including the Joint Vocational School millage) Other purposes (including county, city, village, township, JVS, corporate, and health) Total Rate Effective Rate (for Residential and Agricultural) Income Taxes (presented as a percentage) School Municipal Sales Tax (presented as a percentage) State and Local The following definitions are provided to ease interpretation of the items presented in this sections charts. Property Taxa tax assessed on the value of land and buildings. Counties must reappraise all real estate once every six years. Equalization adjustments are made in the third year following reappraisal. Total Tax Rateincludes all levies, enacted by legislative authority or approved by the voters, for all taxing jurisdictions within which the property is located. Effective Tax RateApplication of tax reduction factors results in a net rate, which is lower than the total tax rate. Percentage reductions are applied to taxes levied against real property being re-appraised or updated. Separate percentage reductions are applied to two classes of property: Class I, consisting of residential and agricultural property; and Class II, consisting of commercial, industrial, mineral and public utility real property. This report presents the effective tax rate for Class I property. Milla mill is $1 for each $1,000 of taxable value. Millage: What a Mill Costs You 1. Take the current tax appraisal value of your property and multiply it by 35% (.35); taxable value is 35% of market value, except for certain agricultural land. 2. Divide that number by 1,000 3. Multiply the result by .9 4. If you live in the dwelling you own, multiply the result of # 2 by .875 5. For a $100,000 home you live in one new mill in taxes will be: $100,000x.35=$35,000/1000=$35x.875=$30.68 Inside MillageThe first ten mills; this is non-voted millage. Outside MillageVoted or mandated millage Permanent not time limited Expiring must be voted on periodically to continue being collected Emergency for a specific amount of revenue
Local Schools Property Taxthe portion of voted and non-voted millage that is distributed to local schools. Municipal Income TaxThe tax is generally imposed on wages, salaries, and other compensation earned by residents of the municipality and by non-residents working in the municipality. It is also assessed on the net profits of business (both incorporated and unincorporated) attributable to activities in the municipality. School Income TaxA resident tax on the amount reported as Ohio adjusted gross income for state income tax purposes less $1,050 per exemption for 1999. The exemption amount is indexed for inflation beginning in 2000. Senior citizen credit a taxpayer 65 years or older during the taxable year receives a $50 credit against school district income tax, one per return. Sales Taxthe taxes paid locally by consumers on the sale or resale of retail goods and services, on rental of tangible personal property, and on selected services. |
 |
 |
 |
 |
 |
|
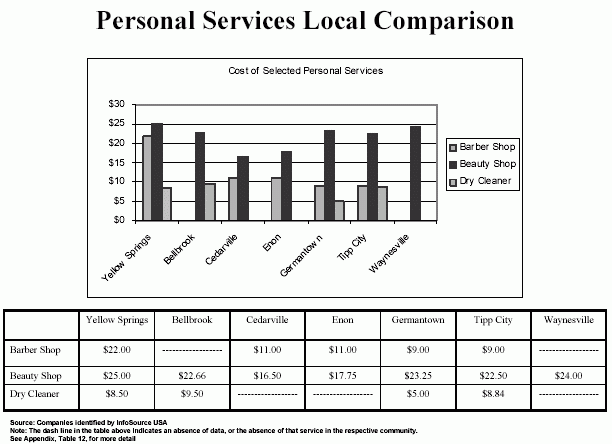
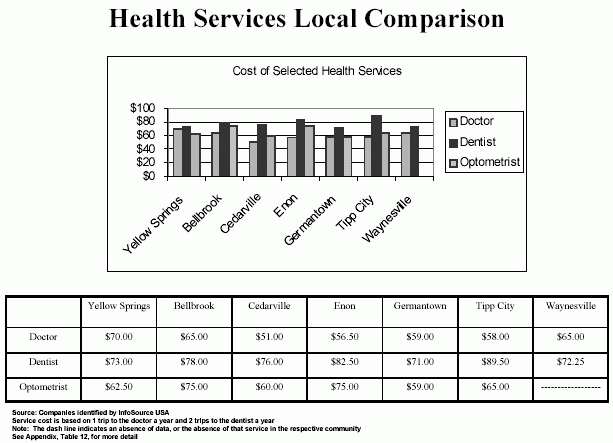
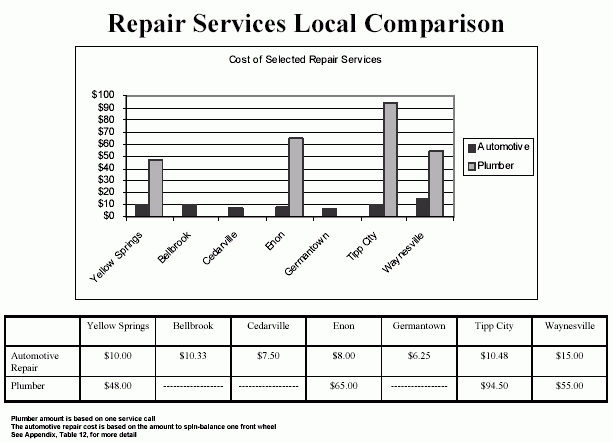
INTRODUCTION AND GOAL The American Chamber of Commerce indicates that the cost of miscellaneous goods and services accounts for 33% of living costs in the United States. Therefore, data on local services were collected for this report. PROCEDURE "Goods" in the Chamber of Commerce model consist of items that are typically purchased from stores with a regional market, such as "mans dress shirt," "mans slacks," and "tennis balls." The costs for these goods, therefore, would not vary within the region, and so this local cost of living report excluded goods from the model. Items presented in this section consist of servicespersonal, repair, and health services. See the list below for specific items. Personal Services
Maintenance Repair
Health Services
The Services Task Group was provided with a list of all service providers in the three service categories that conduct business in Yellow Springs or in one of the other six comparison communities. This list was generated from InfoSource USA. Task group members either called or visited companies to determine current pricing. If two Enon barbershops, for example, provided the cost for a mens haircut (no styling), then the task group calculated the average of those two prices and entered that value into the spreadsheet template. Results are presented in chart form in this section. Details may be reviewed in the Appendix, Table 12. |
 |
 |
 |
|
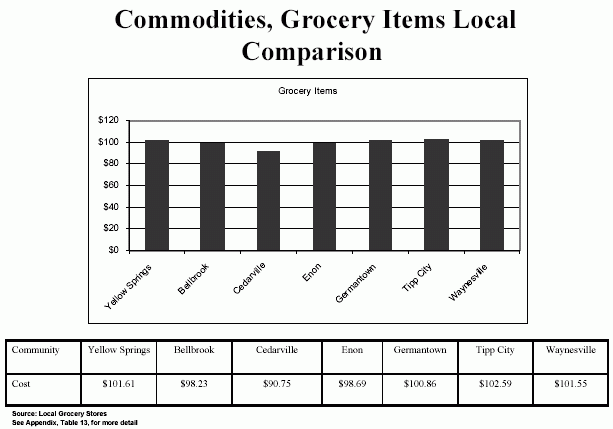
INTRODUCTION AND GOAL According to the American Chamber of Commerce, purchases of grocery items account for 16% of living costs. The towns in this report have local stores where comparison data could be collected, and so grocery items were included in the local model. PROCEDURE In keeping with this effort to compare local costs, the Research Design Committee purposefully excluded major, regional grocery chains from this study. Rather, each towns local grocer was visited in order to collect grocery item costs. The grocery item costs researched for this study are based on the American Chamber of Commerce model and are delineated below. The task group was requested to verify prices where possible with flyers, or other documentation. To ensure uniformity, they were instructed to obtain national brand names wherever possible, using list prices rather than special offers or sales. Due to the rapid flux in grocery item pricing, every effort was made to gather pricing information from stores in all seven communities at the same point in time. Meats T-bone steak - price per pound Ground beef or hamburger - price per pound: lowest price Sausage - price per pound; Jimmy Dean or Hillshire Farms, 100% pork Frying Chicken - price per pound; whole fryer Chunk light tuna - 67 oz can, Star-Kist or Chicken of the Sea Dairy Products Whole Milk - half gallon carton Eggs - One dozen; Grade A, Large Margarine - One pound, cubes, Country Crock or Parkay Parmesan Cheese, grated - 8 oz. Canister, Kraft Produce Potatoes - 10 lbs; white or red Bananas - price per pound Iceberg Lettuce - head; approx. 1.25 pounds Bakery Items - Bread, white - 24 oz loaf, lowest price Tobacco Cigarettes - carton, Winston, King-size Miscellaneous Grocery Coffee, Vacuum-packed - 11.5 oz can; Maxwell House, Hills Brothers or Folgers Sugar - 5 pound sack, cane or beet, lowest price Corn Flakes - 18 oz Kellogg's or Post Toasties Sweet Peas - 15 oz can, Del Monte or Green Giant Tomatoes - 14.5 oz can, Hunts or Del Monte Peaches - 29 oz can Libby's, Hunts or Del Monte Facial tissues - 175 count box; Kleenex Brand Dishwashing Powder 60 oz Cascade dishwashing powder Shortening - 3 pound can, all-vegetable, Crisco Frozen Orange Juice - 12 ox can, Minute Maid Frozen Corn - 16 oz, whole kernel, lowest price Baby Food - 4-4.5 oz jar; strained fruit or vegetable, lowest price Soft Drink - 2 liter Coca Cola, excluding any deposit Toothpaste - 6 - 7 oz Crest or Colgate Shampoo - 15 oz bottle, Suave - xxxx Antibiotic ointment - 1/2 oz tube; Neosporin |
 |